1 | Modern data architecture - Theory and actual implementation
Jon Cajacob, November 2023, This article is also part of the book Business Intelligence & Analytics with Microsoft Power BI
We have arrived in the age of where the effective and efficient usage of data is not only a competitive advantage but also absolutely crucial for the survival of institutions in an increasingly volatile world. With a data architecture we enable people and bring structure in how data is used across an organization to overcome the many challenges that arise when we attempt to unlock the value of data to support processes and decision making.
The topic of data architecture is in general hard to grasp and the many concepts and ideas around it are constantly changing with the evolution of technology and tools available to users. The world of business intelligence and analytics looks very different today than twenty years ago, most importantly because today's software available is much more powerful and flexible while at the same time it is becoming less and less technical to work with data. This allows to shift ownership of data processes and products away from central IT organizations to decentral business teams.
In this article I will introduce the most popular architectural concepts that are relevant today, both from a technical and organizational viewpoint. In particular, we will look at a rather new model, the data mesh. An organizational model that embraces the current state and future of data and analytics in institutions. In the final chapter of this article, I will give my thoughts on what actually works well in practice and how an organization can get closer to an effective data architecture.
1.1 | Theory
Goal of a data architecture
Let's introduce the following simple idea:
— The goal of a data architecture is to bring structure into how data is stored, refined, distributed and used within an organization.
In simplified terms, data is used for operational processes and analytics to support decision making. The focus of this book is the latter, so the following discussion will heavily lean into data architecture for business intelligence (BI) and analytics.
There are three main concepts of how a data architecture can look like from a technical viewpoint: Data warehouses, data lakes and data lakehouses. In addition, there is an overarching organizational concept I want to introduce, the so called data mesh.
Technical perspective: Data warehouses, data lakes and data lakehouses
The following picture summarizes the three main concepts of data architecture from a technical viewpoint:
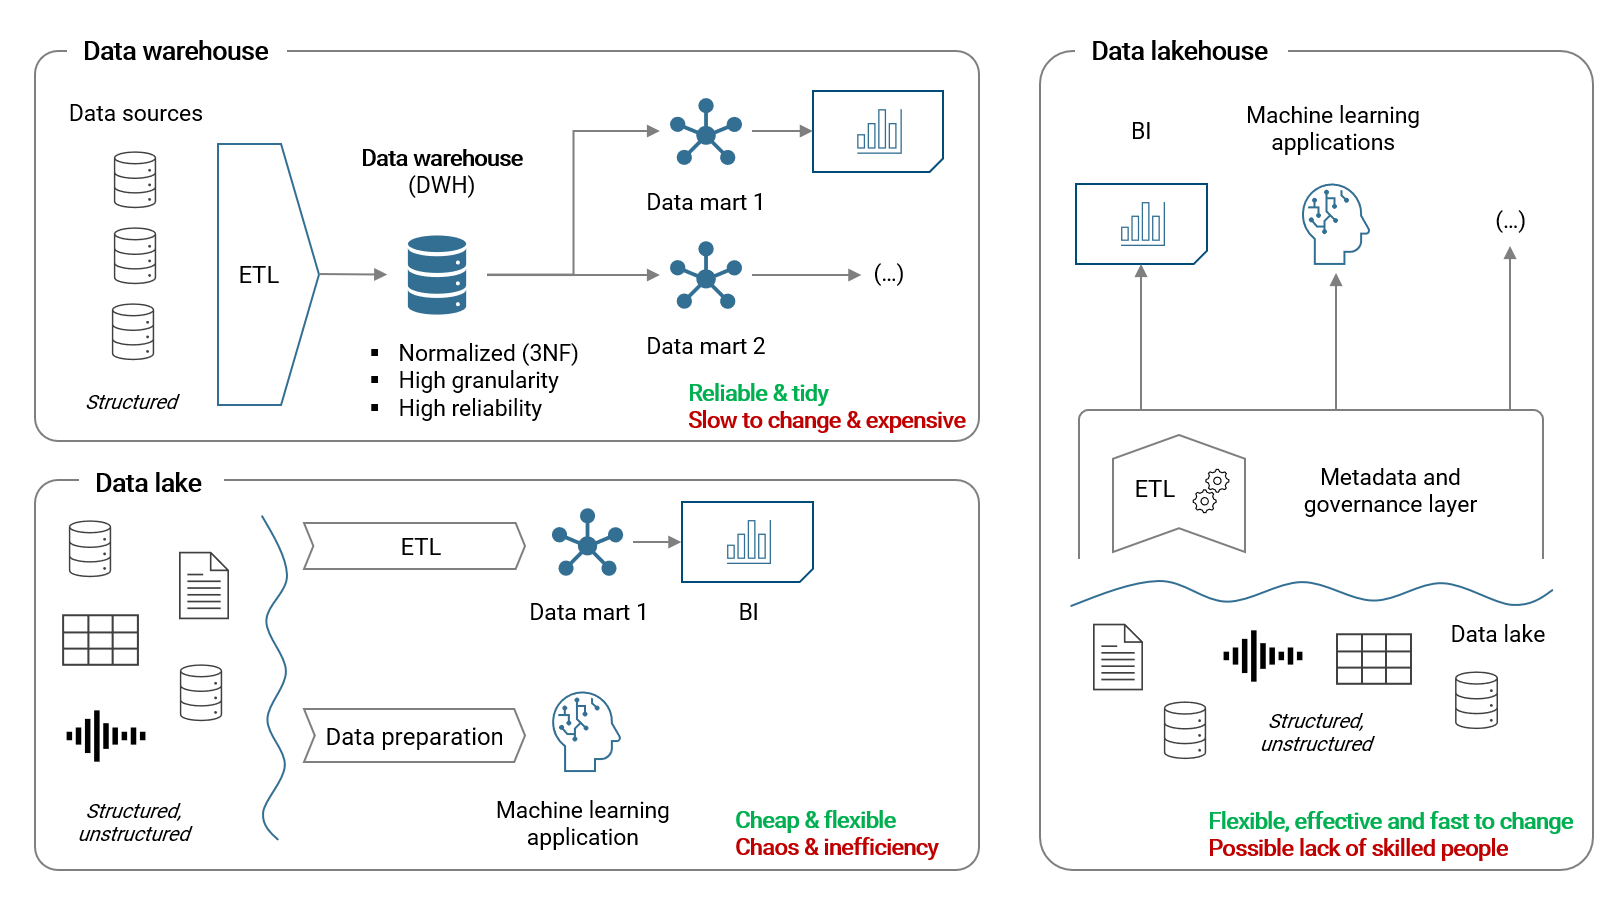
Summary of each model:
Data warehouse (DWH): The DWH is the oldest and most established concept for storing, refining and distributing structured data for analytical purposes. With an ETL process (extract, transform and load), data is prepared and loaded from source systems to the DWH into a relational database. There are usually strict (business) rules for how the data is modelled, how tables look like and relate to each other. Datamarts are use-case driven dimensional star models based on a DWH database and subsequently consumed with BI software. A DWH is usually developed and maintained by a centralized organization. Thus there is usually a bottleneck and a large backlog of change requests coming from the organization's users. Changes are implemented slow accordingly. Further, developing and operating a DWH requires substantial resources and financial investments
Data lake: With the emergence of big data and machine learning applications, the data lake architecture became more relevant. In a data lake, both structured and unstructured data (e.g. free text, audio, video etc.) is stored and unlike for the DWH, there is usually no or only little effort in having the data structured, standardized, refined or tidy from a central or governance perspective. Normally, data is just simply sychronized from a data source to the data lake 1:1 without any refinement which happens only later when individual data teams are working on specific use-cases with their specific toolset. Accordingly, (visible) costs are much lower but so is reliability compared to the DWH. Further, efficiency and collaboration overall is greatly reduced because of the general lack of governance and standardization
Data lakehouse: The data lakehouse is a rather new concept which tries to combine the advantages of cheap data storage in a data lake with the reliability of a data warehouse. In essence, a meta data and governance layer (which includes ETL pipelines) provides the required structure to the data stored in the data lake. Data residing in the data lake is accessed by various applications via this structural layer. This concept relies on a powerful and flexible data platform solution which - if even available on the market - can lead to a vendor lock-in (i.e. you become dependable on one vendor). Further, solutions are built decentralized in business departments which requires skilled people accordingly
The pros and cons of the different technical concepts should become clear by now. A DWH delivers reliable, well-structured data, however does so at significant costs and it cannot keep up with the volatile and fast-changing environment a corporation usually has to deal with. The data lake is cheap but is most often really nothing more than a big pile of all kinds of data. Data teams have to build their own specific solutions that cannot be re-used by other teams due to a lack of a common platform / infrastructure which leads to the opposite of a streamlined data architecture overall. The data lakehouse tries to solve these issues with decentralizing data ownership and the establishment of a shared centralized data platform, however at the risk of possible vendor lock-in and lack of skilled people.
Organizational perspective: Data mesh
Definition
While the previously introduced concepts are technical in nature, the data mesh looks at data architecture from a more organizational viewpoint.
Again, let's introduce a simple definition:
— A data mesh decentralizes data management into data domains (= business teams) that fully own their data pipelines, models and data products. All data domains collaborate on a unified data platform that provides a common infrastructure for data storage, pipelining (ETL), analytics, standards and governance, access permissions and data discoverability.
Data requirements are specific to business domains
The data mesh acknowledges an important fact about business intelligence and analytics: Data requirements are specific to business domains and a centralized organization cannot deliver that (in time) and keep up with change requests. Accordingly, ownership of data pipelines to prepare data and resulting data models, reports and other applications are fully owned (developed & maintained) by the specific business teams (full self-service).
Essentially, ownership of data preparation and resulting products is moved to where the knowledge about data content resides and where data is actually worked with. This not only increases speed and flexibility, but also renders most requirement engineering between a central IT organization and business teams obsolete.
Components of a data mesh
The following illustration summarizes the idea of a data mesh on a high level:
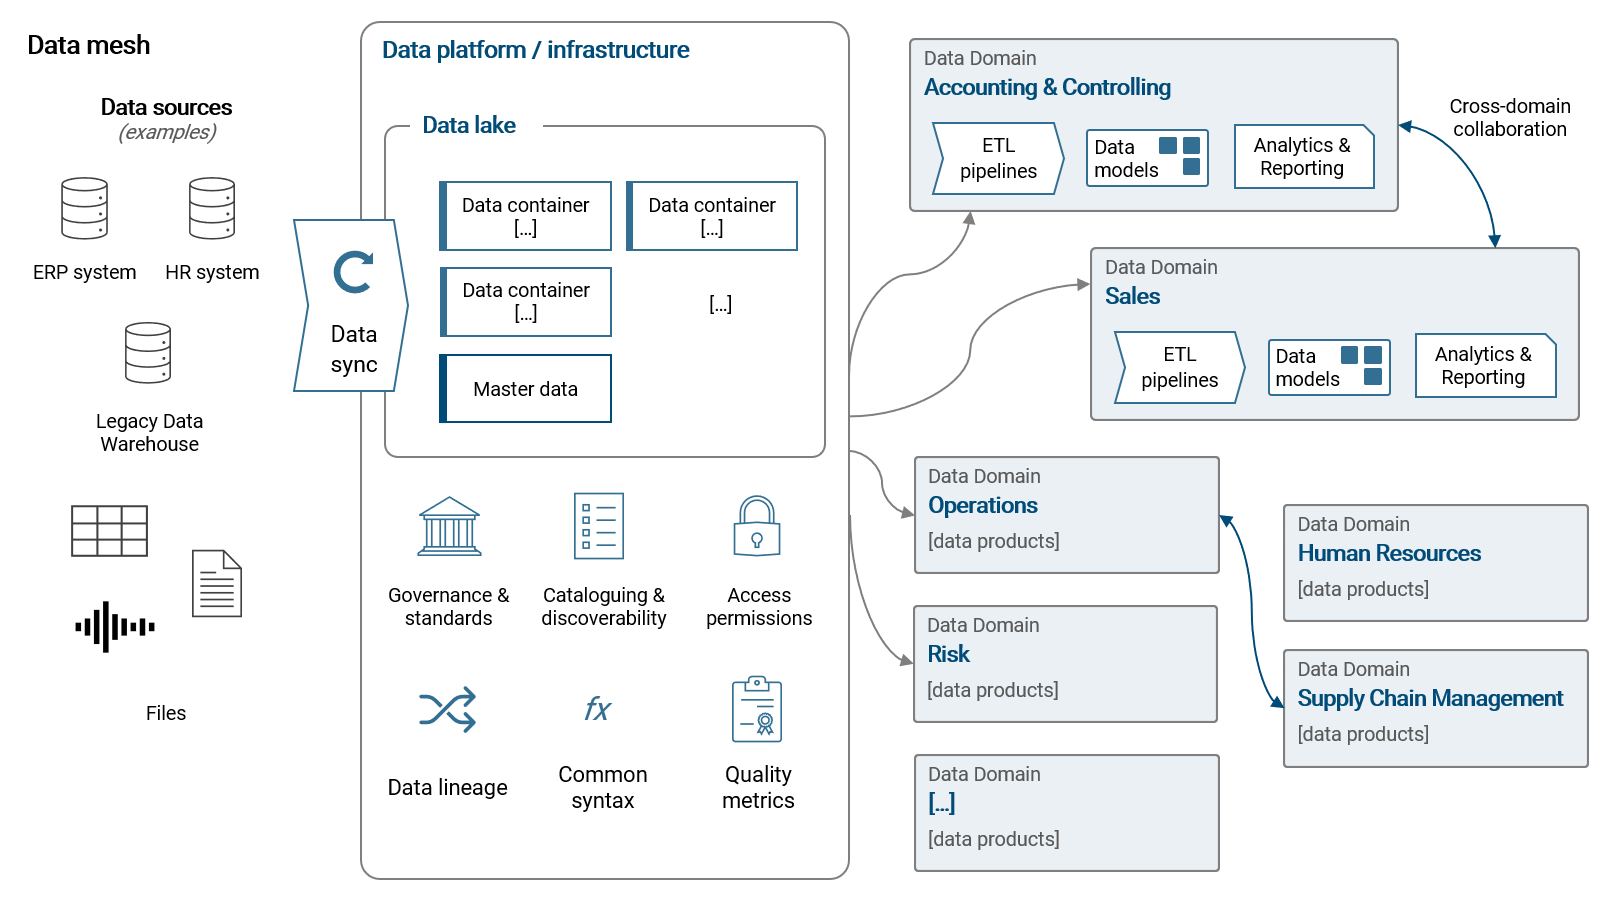
- Data domains are basically business teams (or departments) that naturally have specific data requirements. Of course these requirements can overlap with other teams which makes cross-domain collaboration important, e.g. the controlling team prepares and owns the ledger of accounting transactions which is typically also needed in the sales team
- The data domains develop and maintain their own data preparation processes (ETL pipelines) to feed their BI applications with data. They also fully own their data models, reports or other applications (e.g. a machine learning applications). These elements are called data products and the teams have a natural interest in maintaining a good (data) quality of these products
- All teams work with the same centrally owned data platform. Simply speaking, this infrastructure should enable all teams to share a common language and toolset when it comes to storing, preparing and using data
- In order to enable teams a streamlined access to data sources, data is synced between sources and a data lake that is part of the overall infrastructure. Given that, read-permissions can be controlled (e.g. on a data container level) and the business teams don't have to deal with connectivity to source systems
- A modern platform provides different tools and languages to work with the data. While data scientists may prefer to work with Python or R, a data analyst may prefer to work with SQL or a BI tool like Power BI. The way these tools are integrated in the platform (e.g. connect with data sources) must be standardized across domains
- The platform can give an overview of data products available with a data catalogue and data lineage. The former describes datasets available and fosters discoverability and cross-domain collaboration. The latter is about understanding how data flows from data sources to data products in the organization in order to find potential for future streamlining of pipelines
- Ideally, data products are scored with quality metrics to make data quality transparent and improve it
From this, it should become clear that the data lakehouse architecture summarized before, is the most fitting technological setup for a data mesh.
Skilled people are mission critical
Because we are decentralizing data ownership to business teams, it is critical that these teams have the necessary skills and knowhow to create and maintain their data products.
Luckily, software in the area of business intelligence and analytics has become much more self-service oriented in the past decade, away from coding to low- or even no-code user interfaces. For example, with Power BI you can create a data model and data visualizations with only very little code if the requirements allow it. For more complex cases, there is still the possibility the use specific code, e.g. to create complex calculations with DAX. This flexibility is what makes these modern tools so powerful.
And because modern tools are low/no-code, a person with an analytical skillset and IT affinity can rather quickly learn to work with such tools. To boost learning in the organization, it is highly recommended to set up data communities to exchange lessons learned and to help each other along the way.
Cross-domain collaboration as a key success factor
Not only should data communities be put in place to foster learning from each other, but also to re-use data products across business domains. A use-case that is often observed is the accounting & controlling domain that owns the ledger of financial transactions and the respective dataset. Very often, other teams like sales or risk are also in need of at least a part of that data. Instead of these teams re-creating the same data product, it makes much more sense to re-use what is already there.
Clearly, letting other teams use a data product, can mean more work for the team owning the data product, because surely there will be ideas and change requests coming from the other teams. Further, this leads to cross-domain dependencies. For data products that are heavily used in many domains, it can therefore make sense to centrally develop and maintain those. This is also the case for master data.
Centrally managed master data
If you look closely in the summary illustration above, you will notice that I explicitely mention master data as part of the data lake. It is often the case that master data tables are re-used across different domains and use-cases, like for example product master data, financial accounts or country master data (regional structure). You would be amazed in how many different variations a regional structure / country table can be prepared for the exact same company.
Therefore, it is worth centrally maintaining these tables and ensuring data quality for the benefit of many data domains.
1.2 | Corporate reality and its challenges
Now that we have an idea of how an effective data architecture ideally looks like, let's discuss some of the typcially observed challenges and issues in corporate reality. My own practice has allowed me observe a multitude of different data architectures of small and medium companies as well as large sized, internationally operating, group of companies. From that experience, I believe to be in the position to write down the most important issues to be tackled when trying to bring structure in how data is used across an organization.
Overview
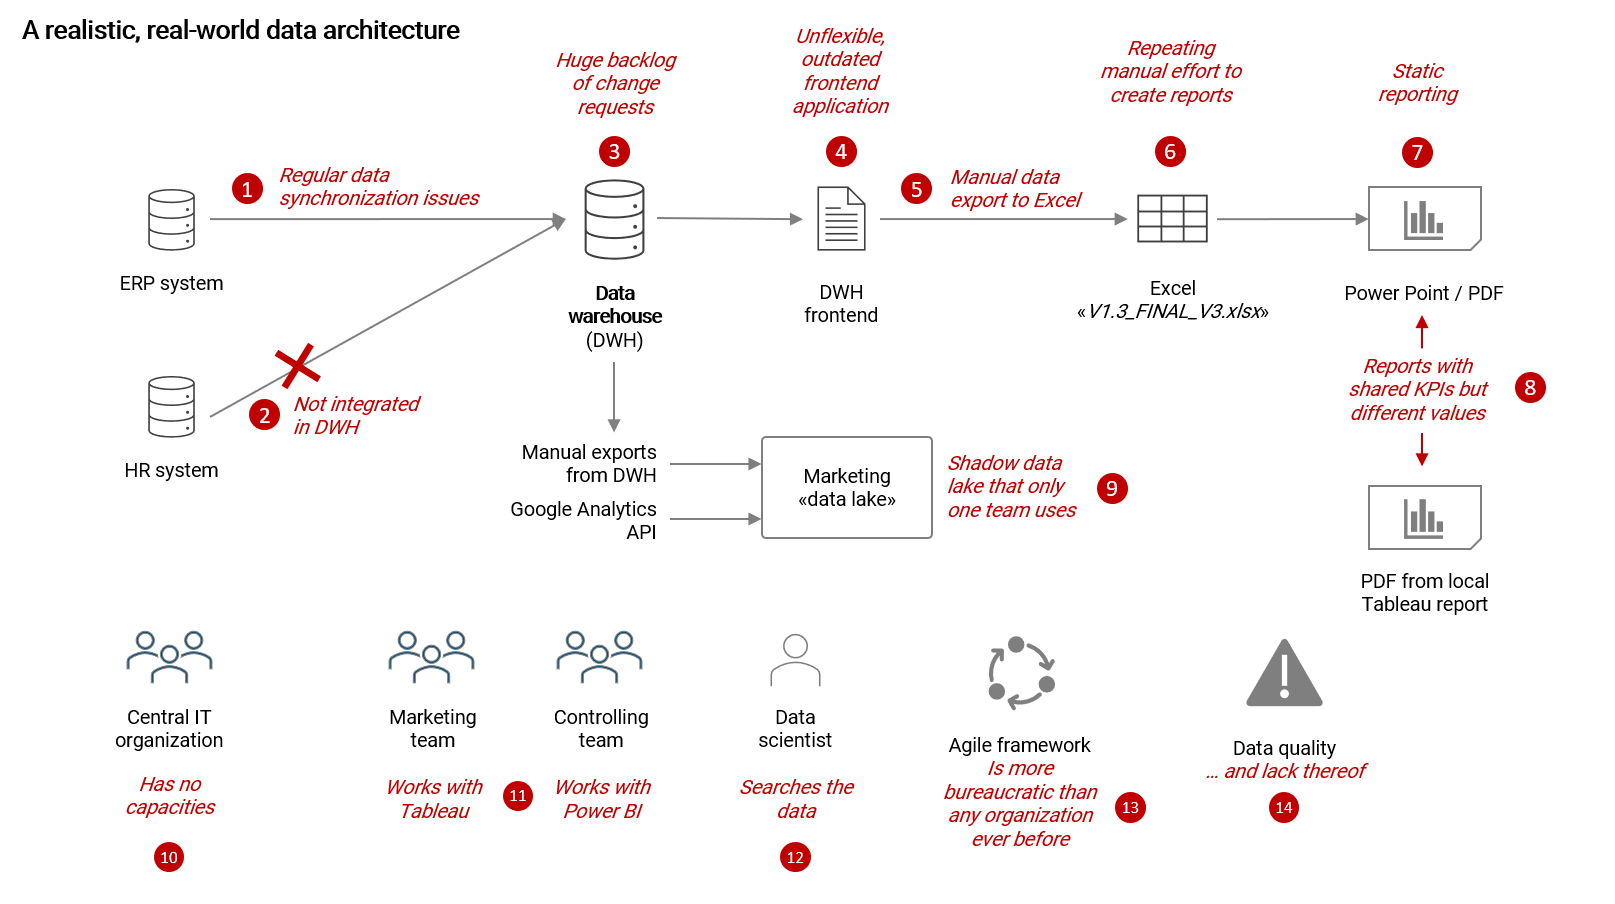
The following illustrates a typical real-world data architecture of a medium sized company and highlights various problems:
Most typical issues observed
- Outdated data: This can happen in any architecture but I still want to note it down here as it is important. Outdated data in a DWH (or any other data application for that matter) quickly makes users loose trust in the data
- Lack of data integration: It is often the case that various systems of an organization are not integrated in an existing data warehouse. Given that, users have to combine data exports with DWH data outside the DWH system (i.e. Excel)
- Huge backlog of change requests: Because a DWH (or any other important data application) is typically developed and maintained by a central IT organization, which is probably running at its capacity limits, there is often a large backlog of change requests coming from the business teams with which the IT team cannot possibly keep up with (see also no. 10)
- Legacy frontend applications: Frontend applications that are based on old, outdated technology are unfortunately more the norm than the exception. The effect of these unflexible, static reporting tools is that users have to export data to Excel and continue from there with their work
- Manual data exports to Excel: See no. 4 - because we cannot work with the outdated frontend, we have to manually export data each time we need to update our reporting or analysis
- Manual efforts to create reports: Here is where most inefficiencies can be found: The repeated, manual creation of reports and analysis. It is usually done with huge Excel files that in the worst case also link to other Excel files. Because so much time is spent with creating a report, there is not really time left to actually explore and analyze the data
- Static reports: The results of all manual efforts are static reports which are unfit to answer ad-hoc questions or to explore data in an interactive way. Unlike with a modern BI tool, KPIs cannot be simply reported with another breakdown (without additional considerate effort), cross-filtered with complex conditions or drilled into
- Deviating KPIs: This is a difficult challenge to deal with in any architecture: Reports that are created by different teams and share the same KPIs, which show different values. This happens because there is a lack of effort to standardize definitions across domains. Please note, also with a modern, decentralized setup, this remains difficult to solve
- Shadow data lakes (or BI systems): Because the central IT organization is too slow with implementing new requirements, teams that heavily rely on data may start building their own "shadow" solutions. The marketing team may start to create their own "data lake" that ingests manual data exports from the DWH (because IT refuses to set up a direct interface) or accesses an API like Google Analytics. From an IT perspective, this is an unwanted scenario because often these solutions are developed and operated by a single person that has all the knowledge. Now if this person leaves the company, who will take care of the solution going forward?
- Lack of IT resources: As more business processes are digitalized and analytics gets more important for competitiveness, pressure on IT organizations keeps rising. At the same time, there are budget restrictions and finding skilled people remains difficult. As a result, central IT organizations have a hard time keeping up with change requests from the organization on top of maintaining applications that are already in place. This leads to a bottleneck and business teams have to wait (too) long for their requirements to be implemented
- Lack of a common data platform: If there is no common data platform / infrastructure and no clear leadership or guidance on that matter, business domains will start to build their individual shadow applications. The problem gets worse with the passing of time because the more of these shadow solutions are in place, the harder it will be to integrate them in a unified data platform later
- Data scientists that are lost in the organization: A data scientist's job should be to build machine learning algorithms on top of datasets to support decision making processes. However, the reality is, that they will spend the majority of their time searching and cleaning data. In particular searching data is a considerate waste of resources but it is the often observed in reality because there is not really any cross-domain collaboration or a catalog of available datasets
- Agile bureaucracy: The original agile manifesto for software development that was created in 20011 is based on simple, people and customer focused principles. Unfortunately, in today's world the way agile is used in medium and large size companies is anything but agile anymore. Rather, it has become a "framework" of fairly complicated and bureacratic processes with terms that only "agile coaches" really understand. In my own experience, these frameworks are often slowing down progress, reducing the actual agility of the organization and it frustrates users as they have to wait for their requirements to be considered in the next "PI planning iteration". Agile has unfortunately become a commercial product that is sold by "agile experts". This is not to say that agile is a bad idea in general, but companies and institutions should be mindful to not just implement a framework but to use of the agile toolbox what is actually useful for their specific requirements
- Lacking data quality: A with important issues wouldn't be complete without mentioning data quality. Lacking data quality is a problem that will never go away, no matter the data architecture or tools used. However, there are some tactics to actively manage the topic and improve the situation, like for example making quality issues transparent with metrics and people responsible to improve them over time
Given these typical issues, it is easy to conclude that there can be a lot of value in a modern data architecture.
1.3 | Guidelines for an effective data architecture
Now that we know how a modern data architecture may look like and what challenges it has to overcome, we are in the position to conclude on guidelines for an effective data architecture.
Change is constant
Before we have a look at the actual guidelines and components, we need to understand and accept an important reality: We will never achieve a perfect steady state for our architecture that solves all the before mentioned problems. This is simply impossible in a world where framework conditions are volatile and constantly changing.
The main goal for an effective data architecture therefore is to enable the organization's people to react quickly to these changing conditions. We want to achieve actual agilty and adaptability. Given that, there is very little time and space for bureacratic processes and hierarchical structures. People should be motivated to move fast, to make mistakes and learn from them and continuously improve going forward.
Components of an effective data architecture
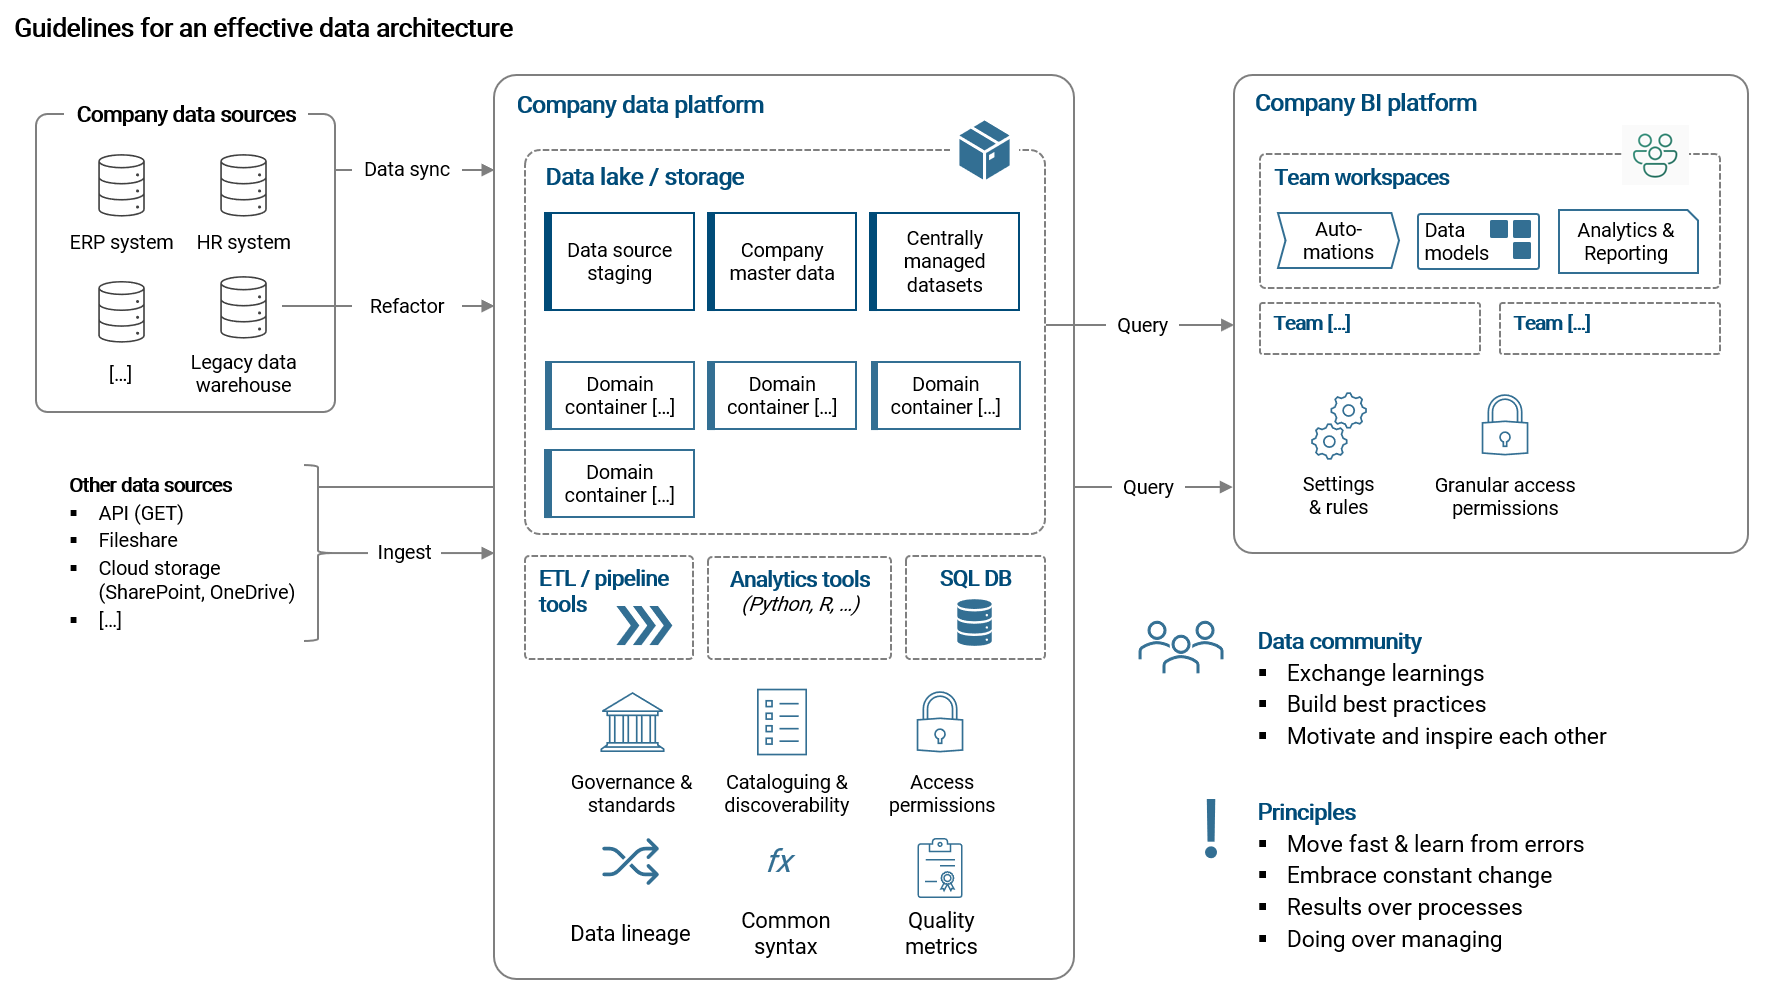
The picture below shows my idea of an effective data architecture.
To summarize, we use a unified, centrally managed and easily scalable data platform that enables business teams to access, store and model internal and external data as required. It should be possible for users to create and provide result datasets that are then accessed by their BI application. Ideally, the platform also allows data scientists to work on machine learning solutions (with notebooks etc.). It is important that (1) business teams should not have to worry about things like data security or performance and (2) accessing and working with the platform should be as simple as possible.
With the BI platform, data from the central platform is accessed and loaded into data models that are the base for data analysis and visualizations. Teams should have their own workspaces (where they are administrators) and they should be able to control granular access permissions by themselves. The central IT organization owns and runs the platform, including making sure the settings are in line with the domain's requirements.
Building a community of data workers is crucial for making sure that learnings are exchanged and best practices are built and continuously improved. Also, we should not forget that creating new solutions and learning new skills is hard so therefore the community should provide additional motivation and inspiration for everyone.
In the following I will go into more detail for each component.
1. Company data platform
The company data platform is the central hub where business teams can easily find, access, model and store data for their specific use-cases. It is developed and operated by a central (IT) service team that takes care of the platform's stability, performance, data security etc.
The platform should be scalable in performance and storage capacity. Most importantly, working with the data storage and data tools (see below) should be intuitive, user-friendly and self-service oriented.
Further, because we want data products (in most cases data tables) to be re-used across the organization, we need to make sure there is a data catalogue in place that enables discoverabilty of what is already there. Users should be able to tag and describe data tables (meta data) and ideally there are quality metrics in place that score the quality of a data table and make issues transparent (e.g. a more incomplete table with more null values has a lower score).
From a central perspective we want to further understand from where to where data is flowing to. For that we need a good data lineage tool. This will help us to observe patterns across the organization and understand potential for streamlining at later stages.
Think of the data platform as a workshop where data is the material people work with using a selection of tools to create products with value for the organization.
2. Data sources and storage
The central service team makes sure that all relevant company data sources are available on the platform, either by data synchronization (i.e. staging) to specific data containers or secure data gateways to the original data sources (though rarely recommended). Accessing company data sources is something business teams should not have to worry about.
Each business team should have their data storage container(s) with configured access permissions accordingly. It is where teams copy data from the staging containers, load their own additional data and store intermediate and final results from ETL pipelines. The final data result sets are then consumed by the BI application.
The chain from raw to refined to final data is commonly referred to as the bronze, silver and gold stages of data (also called medallion architecture). Please note, the intermediate stage of results ("silver") can also be skipped as it is not relevant for many use-cases.
Ideally, the business teams should be enabled to set up their own SQL databases which are then queried by the BI application (it is in many cases the best type of data source for a BI tool). Modern data platforms like Microsoft Azure allow the implementation of serverless SQL databases where data is not physically stored in SQL tables but so called external tables (via CETAS statements) act as an interface to an underlying storage container where the data tables are stored in a certain format (mostly Parquet). This concept is also referred to delta lake.
As noted before, it makes a lot of sense to develop and maintain important master data tables by a central team as usually several different business domains require the same master data. This means additional efforts for the central service team but in my experience it is really worth it. A welcome side-effect of that approach is that (hopefully) data quality issues get more attention and are then improved down the line.
3. Data tools
Each business team needs to be enabled to prepare and model the data they need for their use-case. For that we use ETL pipelines with which we perform the usual data preparation steps like filter, select columns, different types of joins or change of data types.
It is absolutely crucial that these tools are low-code and allow for robust ETL processes. If the platform cannot provide that, we need to rely on ETL tools of the BI platform if available. A good example is Power BI with its tremendously strong and self-service oriented ETL tool Power Query.
In addition to tools for ETL processes, ideally data scientists can work with notebooks using popular languages like Python or R to build machine learning applications.
Of course, the platform should also allow the usage of the SQL language for queries etc.
4. Company BI platform
The company BI platform is where we query data from the central data hub and build data models and reports upon it.
The platform has two components: The actual BI tool itself to develop models, calculations and visualizations. And an online platform where datasets and reports are hosted and shared within the organization,
Again, it is mission critical that the BI platform is user-friendly and intuitive to use (which is the case for most market leading platforms). Further, the BI tool has to have a very large worldwide community of users (which is only the case for SOME market leading platforms). Because that will make it easy to find solutions and answers for problems and questions your people with naturally encounter. Further, a more widespread tool like Power BI will make it much easier to find and hire new people with the necessary skills.
When deciding for a BI software, make sure the platform has a strong track record of continuous development and innovation. And this continuous development should be in areas that are actually important to report creators and consumers (e.g. fancy sounding "AI augmented" tools are not important as they are rarely used in practice).
Please note, deciding which BI platform to use is primarily a business decision, supported by the central IT organization. Central IT is supporting the process in evaluating if the platform in question is fullfiling requirements in terms of security, performance and reliability.
5. Data community
Each business team will make important learnings along the journey. It is highly recommended that these learnings are exchanged among the data workers in your organization. Furthermore, the data community is the place to build and establish best practices (for example how to make a data pipeline more robust). Don't try to create and enforce rules top-down.
A data community can be institutionalized via regular meetups (online / in person) and a sharing platform / forum (e.g. via a MS Teams channel, Slack or Yammer etc.).
6. Guiding principles
We have already clarified that change is constant in the beginning of this chapter. Naturally, it is an important principle to move fast, be (actually) agile, make mistakes and continuously incorporate learnings along the journey. The moment you will start to (over-) formalize things, you will slow down progress. We should not forget, that most people working with data are intrinsically motivated to create good quality data products and to support and improve business processes. The role of the effective data architecture is to enable these people to exactly do that.
For the last principle, we want to be careful about the ratio of people managing or coaching things versus people doing, i.e. developing, testing and fixing, things. If you see slow progress in your organization in terms of effective and efficient usage of data, have a look at this ratio. Progress and good data products will mostly be produced by the latter. Make sure that career and progression paths for data workers in your organization reward being innovative and getting things done accordingly. There is of course still a need to coordinate, plan, prioritize and tying things together and for that we need people with managerial roles. However, we must aim to keep a healthy ratio of developers & fixers versus managers & coaches.
Data architecture for smaller scope use-cases
The just described data architecture is for many organizations too large in scope, too expensive, too complicated or too resource intensive to manage. This can be because the use-case(s) do not require a full-fledge architecture. Or there is just not enough funding available to build a data platform architecture. Or maybe we want to take small steps and start with a simpler architecture on our data journey.
For such cases, the following single-platform solution may be the better choice:
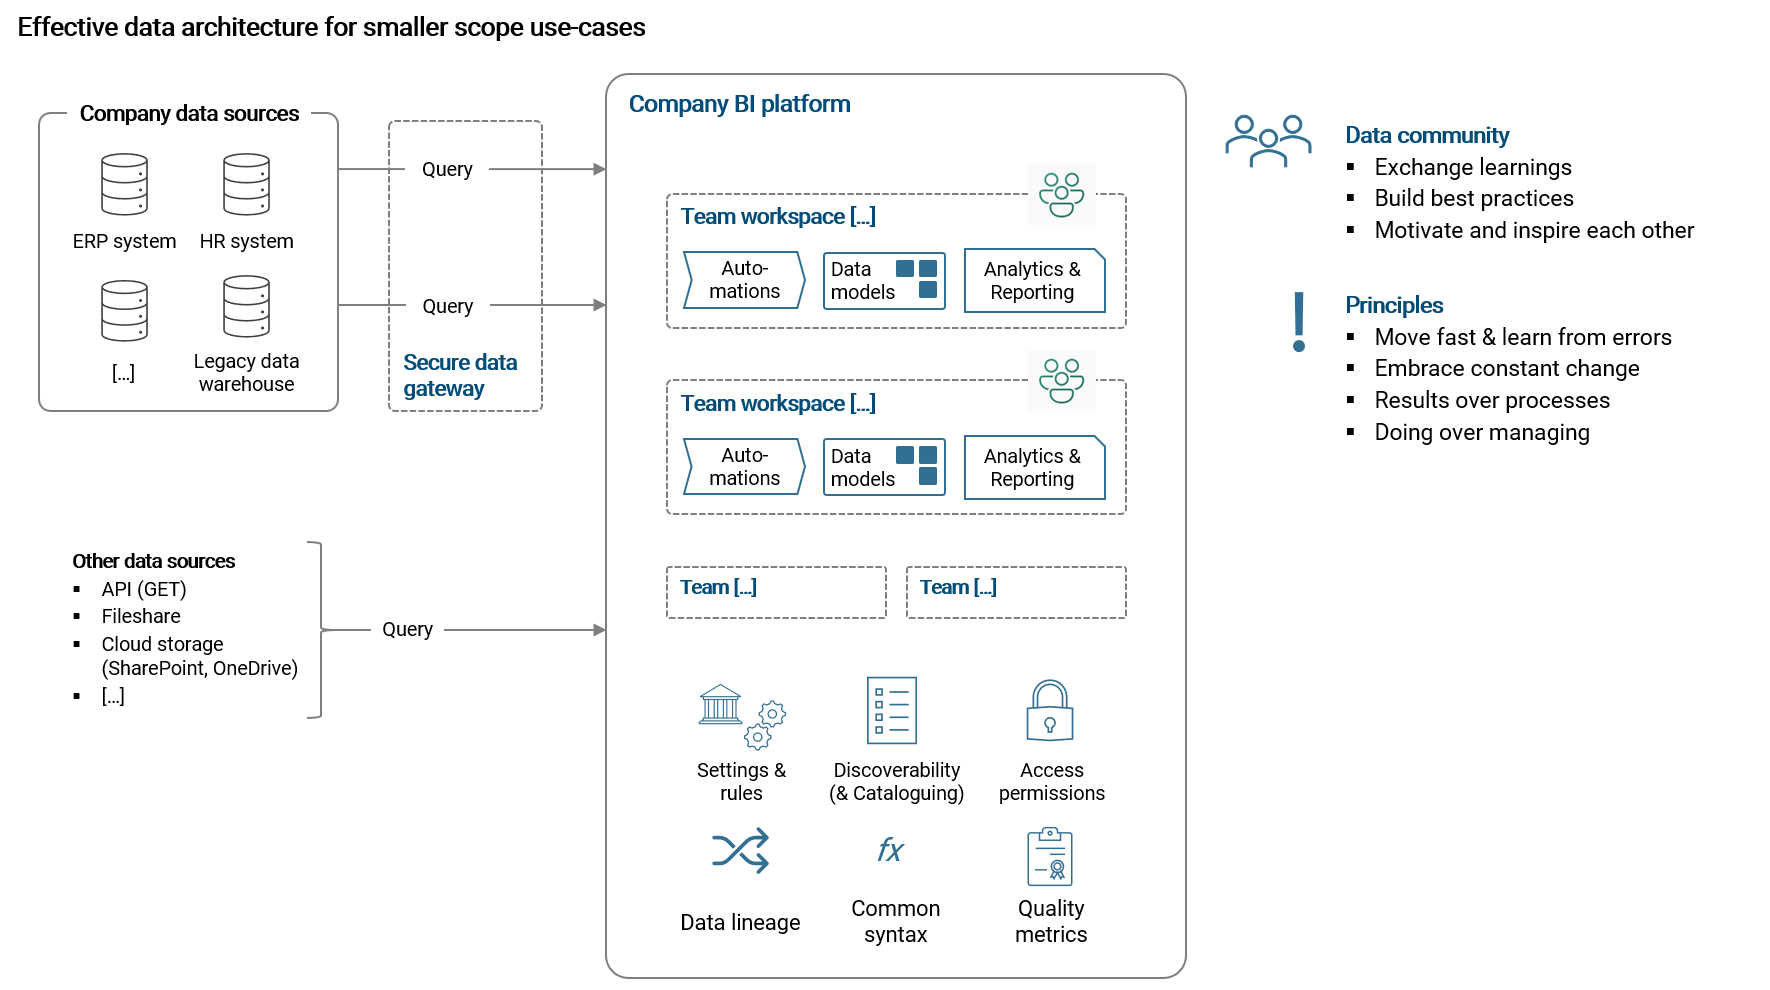
For a more simple architecture we can use the BI platform as our only central data platform. Today this is possible as more and more market leading BI tools are not only focused on data visualization and reporting, but also come along with a toolbox for data preparation (ETL), modelling and sometimes even data staging.
Power BI from Microsoft is by the far the strongest BI platform today in that regard and I want to take it as an example of a single platform solution here. Besides report building, it offers the following additional tools:
- Power Query to prepare data
- Dataflows to prepare and stage data tables for re-usage
- Data modelling capabilities to build star schema models
- Power BI Online Service (via Internet browser) with workspaces to share and re-use data products
- Power BI Gateway to control and share access permissions to data sources
- And the newest addition: The possibility to build data lakehouses using Microsoft Fabric
Furthermore, Power BI has tools to understand data lineage, to endorse data products for better discoverability and central tenant settings that allow for flexibility in how various functionalities are used across the organization (e.g. rules on exporting data from reports).
On the downside, because we have no data platform in place, we need to be careful on computational burden on data sources when we are querying them directly from the BI tool. To circumvent this problem, we could use dataflows in Power BI to stage important data (e.g. the ledger of financial transactions) and share that staged table with data workers that need it. Further, with such a setup we are disregarding our data scientists who have to create their own environments outside the BI platform to work with the data. Also, it is much harder to streamline data processes across the organization as the business teams will likely re-create them for their own purposes.
Conclusions
We should by now have a good understanding of the purpose and components of what we can consider an effective data architecture. Today's technology, the growing importance of data and the increasingly volatile framework conditions make us want to decentralize the creation and ownership of data products to business teams. The role of the data architecture is to enable our teams doing exactly that in the most efficient and effortless way possible.
In an early stage, the business teams use the central data and BI platforms to work on their specific use-cases. In a more evolved stage, data products are discovered and re-used across the organization with cross-collaboration which increases efficiency additionally. At a very evolved stage, we start to understand patterns in the organization which helps us to further streamline the usage of data with for example centralizing heavily used master data tables. The better discoverability and cataloguing of datasets makes data quality issues transparent and we can start to continuously fix them.
The data architecture needs to provide centrally managed platforms to find, access, prepare and analyze data in the most intuitive and user-friendly way possible. We use a data platform that offers capabilities to access, model (ETL) and store data and to create machine learning applications. Then we use a BI platform to query data from the central hub and build visualizations and reports to be shared in the organization to support processes (with increased automation) and decision making. For a more simplified and less resource intensive implementation, we only use a modern BI platform that offers data preparation capabilities besides report building. In all cases, we are careful to choose software which uses standard syntax (SQL, Python, R, DAX etc.) and has a large user community worldwide.
As guiding principles we embrace constant change and are brave to make mistakes along the way. We want to be (actually) agile and therefore we stay vigilant about overly bureacratic processes, even if they are labelled as "agile". In order to see progress, we have to focus on getting things done. Therefore, we should keep a healthy ratio of people doing things versus people having managerial, coaching or coordinating roles.
The better and intensified usage of data will or is already becoming crucial for survival of companies in competitive markets. It is therefore unavoidable to think about and start building an effective data architecture. The sooner you start making the first steps in that direction and enable your people who are likely eager to build and improve things, the better you will be positioned in the future. Why not start today?
Thank you for reading! - Jon